Map Symbols
ElevationFeatures are often shown by solid, dashed, or dotted lines of various
colors: brown topographic contours; blue lakes, streams, irrigation ditches,
etc.; red land grids and important roads; and black for other roads and
trails, railroads, boundaries, etc. Point symbols depict buildings,
campgrounds, mines, springs, water tanks, and wells. Place
names are shown in various colors corresponding to the type of feature.
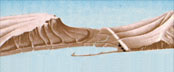
Ground Configuration shown by contours |
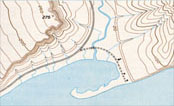
Topographic contours (brown lines) are lines of equal elevation that show the shape of the terrain. Index contours (usually every fourth or fifth contour) are wider or darker. Contours that are very close together represent steep slopes, while widely spaced contours or an absence of contours, represent relatively level ground slopes. The contour interval (elevation change between adjacent contour lines) is usually printed near the scale. A map of a relatively flat area may have a contour interval of 10 feet or less, while a map of a mountainous area may have a contour interval of 100 feet or more. Elevations are printed at frequent intervals on index contour lines to allow interpolation of elevations of adjacent contours. Bathymetric contours shown in blue or black give the shape and slopes of the bottom of water bodies.
| Top |