| ezANOVA: simple analysis of variance |
Contents:
ezANOVA is a free program for analyzing data. I developed this program for a statistics course I taught. It is not a particularly powerful tool, but it is useful for illustrating how the basics of Analysis of Variance. You can download this software from the web. The software is available as a Zip-compressed file. You only need to download one of these files:
The project is open source. You can get the source code from Github. Github also allows you to report any issues you encounter.
As a first example, consider that we collect data examining how someone's environment influences their typing speed. We measure the words-per-minute a participant can type. Each of the 15 participants is tested in only one of three conditions: in a room where Bach's classical music is played, in a room where contemporary rock and roll is played or in a silent room. Hypothetical data might look like this:
| Sound | |||||
| Bach | Rock | Silent | |||
| Alice | 48 | Nancy | 47 | Ray | 64 |
| Bob | 40 | Carl | 38 | Andy | 44 |
| Donna | 31 | Karen | 32 | Heidi | 41 |
| Nick | 26 | Tom | 33 | Emily | 32 |
| Sandra | 58 | Betty | 55 | Sally | 59 |
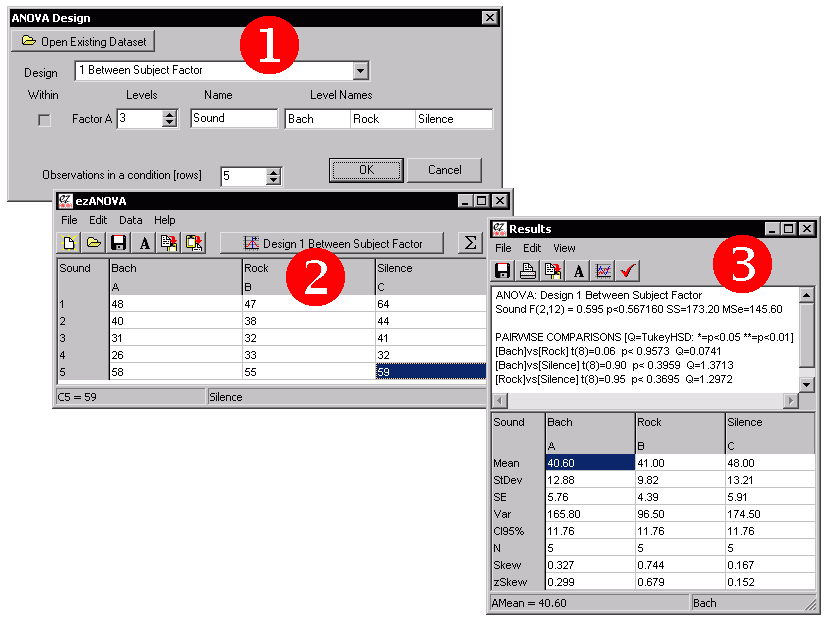
Lets now analyze this data with ezANOVA. Start by launching the program (double-click on the ezANOVA icon). Then choose 'Describe design' from the data menu. You will be shown the design window like the one shown by the red '1' in the figure on the below.
At this point you will see the data entry window (shown by the red '2' in the illustration). Enter the values for each particpant by clicking on the cell in the spreadsheet and typing the observed typing speed, as shown. Note that the first column is labeled "Bach" - you want to enter the five values for people who typed in the room with classical music into this column. You probably want to save your hard work to disk, so you can re-analyze the data any time you want. Choose 'Save' from the 'File' menu to save your data to disk.
When you are done entering values, press the 'Sigma' button. You will be shown the results window (shown by the red '3' in the illustration). Note that the top of the window shows an ANOVA results table. The factor 'Sound' is not significant (the "p<0.5672" suggests that the effects observed could likely be expected by chance).
The lower portion of the results window shows you the descriptive statistics: the mean, standard deviation (StDev), variance (var), number of observations (N), Skew and Z-Soce for the Skew (zSkew) are all shown. Choosing 'Copy' from the 'Edit' menu will allow you to copy these results to Excel or any other program for drawing graphs.
In the previous (between groups) example, each participant was only tested in a single condition. For example, Alice was only tested listening to Bach, and in no other situations. Note that some people are much better typists than others. Therefore, individual difference may be adding a lot of variance to our data. Since we only tested 5 people in our study, it has very little statistical power to find real effects. One way to increase the statistical power is to test the same individuals in each condition. That way, we can take into account the participant's overall typing speed.
Again, lets consider a hypothetical experiment. The design is similar to the between-subjects condition, except that we only test 5 people, and each person is tested in each condition. The data is shown below. Note that Nick is pretty slow in all conditions (never typing faster than 33wpm) while Sandra is generally a fast typist (never slower than 55wpm).
| Sound | |||
| Bach | Rock | Silent | |
| Alice | 48 | 47 | 64 |
| Bob | 40 | 38 | 44 |
| Donna | 31 | 32 | 41 |
| Nick | 26 | 33 | 32 |
| Sandra | 58 | 55 | 59 |
Analyze the data exactly as the between-subjects data, except set the Design window's pull-down menu to '1 Within Subject Factor' is selected. Note that if you have already analyzed the between-subjects data described above, you can simply open that dataset and choose 'Describe design' from the 'Data' menu of the data entry window and change the Design pull-down menu to '1 Within Subject Factor'. Notice when you enter the data in this design you need to make sure that each row of data refers to the same participant. In our example, the first row of data are the typing speeds for Alice, the second row are the speeds for Bob, etc.
Once you have described the design and entered the data, choose 'Calculate ANOVA' from the Data Entry Window's 'Data' menu. The resulting results should look similar to those presented in this figure:
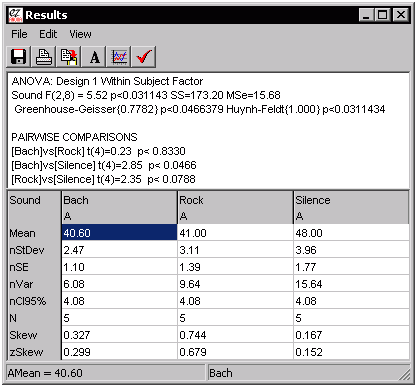
Inspection of this figure shows that there is a significant effect of the sound in the room of the typist (the ANOVA reports a P value of "0.0311", indicating that there is only a 3% chance this finding is due to random noise alone). Because the ANOVA looks at all 3 levels of your experiment, you probably want to look at the pairwise comparisons (repeated measures t-tests) to see what is influencing the effects.
One of the powerful aspects of ANOVA is that you can tease apart how different factors influence your data. My software allows you to analyze up to three factors, with either between or within factor designs.
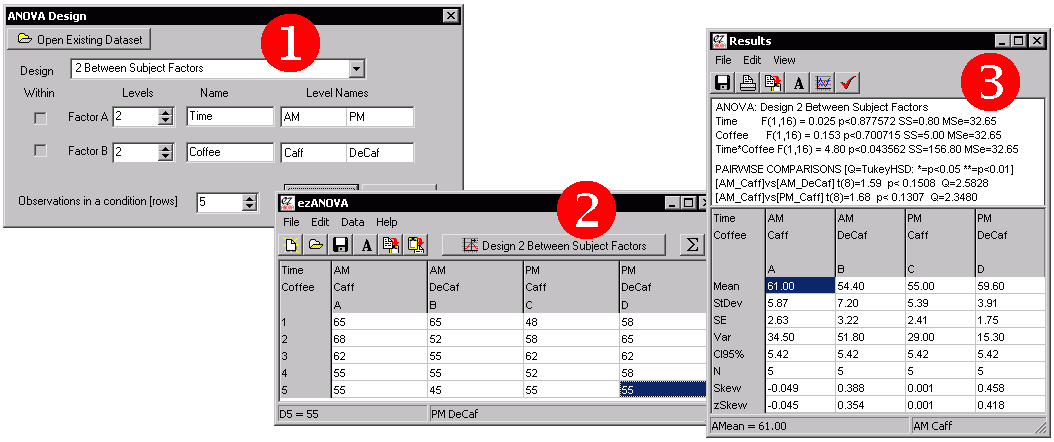
Lets consider a hypothetical experiment where we are interested in how time of day as well as consumption of coffee in the morning influence exam scores. We have 20 participants, half of whom are tested in the morning and half are tested in the afternoon. Half of the members of each of these groups is given a caffeinated coffee in the morning, while the other half receive a decaffeinated coffee. Therefore, there are a total of two factors (time of test and type of coffee) each with two levels (AM versus PM test time, caffeinated versus decaffeinated coffee). Note that each individual only takes the test once (it is a between groups design) and that the independent measure is the score on the exam.
The figure shows each stage for analyzing this data. We begin by using the Design window to describe setup of this experiment. Next we use the Data entry window to report the scores for each participant in each condition. Finally, we can choose 'Calculate ANOVA' from the 'Data' menu to see the results of an ANOVA. In this example, we find that the main effect of time of day has no effect, nor does the main factor of the type of coffee the participant drank. However, we do find an interaction. In this case looking at the pairwise comparisons we can observe that those who drank caffeinated coffee performed better in the morning but worse in the afternoon than their counterparts who drank decaffeinated coffee.
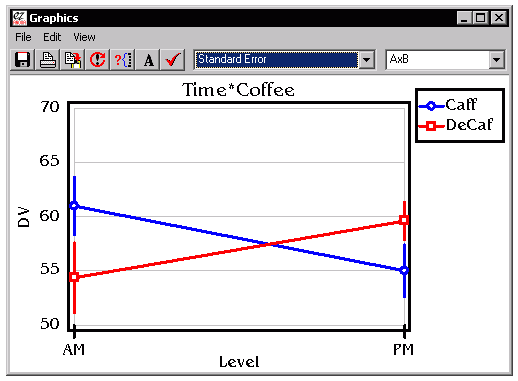
| This software can also show you a graphical image of
your data. Once you are in the results window, you can
choose 'Line Graph' from the 'View' menu. You will be
shown a graph of the mean results for each condition with
confidence interval error bars. You can customize the
appearance of the graph (e.g. choosing the font and data
range). In fact, you can copy or save these images to
disk (in the standard '.EMF' format) so you can edit the
images with Microsoft Word or many other programs. This
graph is a vector-based graphic, so it should not appear
jaggy if you print out the image. Note that you can only make graphs for one or two-factor ANOVAs, and that this graphing tool is fairly basic. Another option is to copy the data from the Results Window into a program that has more powerful tools for generating graphics (e.g. Microsoft Excel). |
 |
We can also create mixed designs, with some factors having a repeated measure while other factors are between subjects. For example, consider if we wanted to test the fuel economy of a hybrid car versus a version of the car with a conventional motor. In this case, the cars wil be between subjects - we comparing different cars. However, we might want to include a between subject factor such as performance in the city versus highway mileage. We could reduce some of the variability between individual cars by using the same car in both settings. The steps for creating a mixed design are:
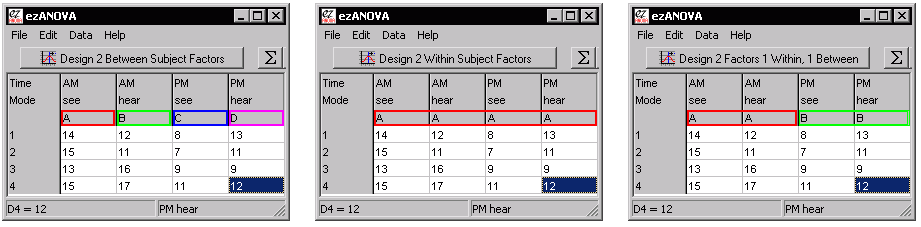
One tricky thing is keeping track of which cells are related to each other with a mixed design. With the pure between-groups design, each cell is independent, while with a pure repeated measures design each row shows the data from a single individual. In a mixed-design, some conditions are tested across subjects while some are tested between. When you design a mixed design, ezANOVA requires that the mixed factors are the bottom factors in the design window. This means that the related measures are next to each other on the spreadsheet. The spreadsheet also has letters along the top to help identify repeated measures. This is illustreated in the figure below which shows a between-subjects design (left), a repeated measures design (middle) and a mixed design (left). Note that in the between-subjects design each column has a unique letter: the columns represent independent subjects. In the Within subject design, all columns are designated 'A', meaning that all the columns in a row come from the same subject. Finally, the mixed design shows that the first two columns come from one subject and the next two from another.
ezANOVA is specialized for computing balanced analysis of variance designs where there are no empty cells (we have equal numbers of observations in each condition, and every participant provides the same number of observations). These designs are the most common for ANOVA, and also the designs where ANOVA has the most statistical power (e.g. ANOVA has a good chance of detecting real differences). If your data do not fit these criteria, you probably want to try another technique (e.g. Mixed Effects models). In contrast, most other statitical software does not constrain you as much, giving you the option of using many statistical tests. The advantage of the ezANOVA approach (which is similar to the no-longer available SuperANOVA package) is that by specializing in ANOVA, ezANOVA can make data entry and visualization simple and compact.
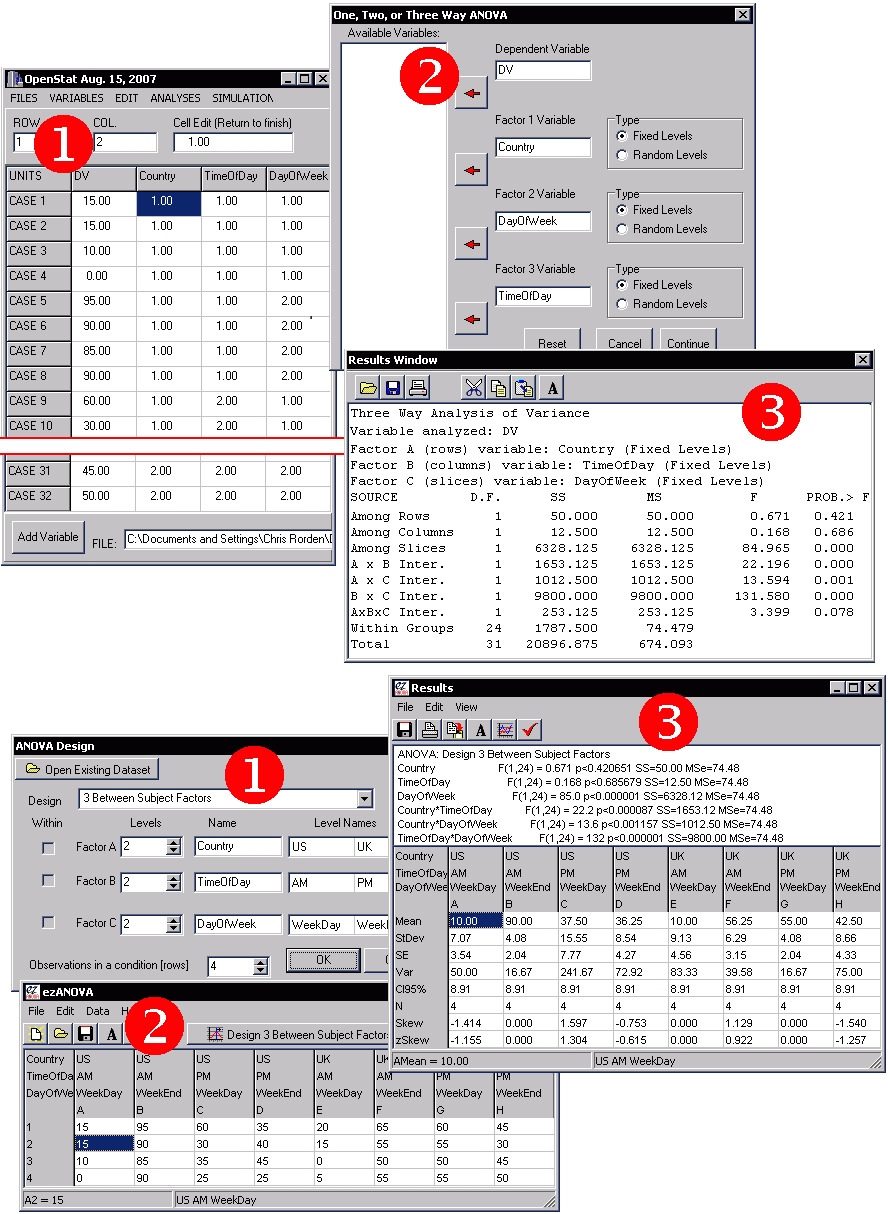
The figure below illustrates the same analysis run on the fantastic LazStats package (which is free, but similar to popular professional packages like SAS) and on my ezANOVA. In this example we are running a 3 Factor between subjects design with 2 levels in each factor (2x2x2). Each condition has 4 observations. With OpenStat you will enter in each of the 32 observations as a separate row, and each row has four columns: the observed value plus the level for each of the three factors. Therefore, with OpenStat you will enter (32x4=) 128 values into the spreadsheet (step 1). Once this is done you select the 'One, two three way ANOVA' submenu from the 'Analysis of Variance' item in the 'Analyses' menu (step 2). You can then view your results (step 3). The ezANOVA approach is shown below the OpenStat approach. We first describe the design (step 1). Next we only need to enter the 32 observations (as the spatial location of the observation determines the condition, step 2). Finally, we can run the analyses.
I think ezANOVA is a great tool for learning the concepts of Analysis of Variance. For many people, it will do everything they need. However, power users will probably prefer the flexibility of the standard (e.g. OpenStat) approach.
| Term | Notes | ||||||||||||||||||||||||||||||||||||||||||||||||||||||||||||
| Alternatives | While ezANOVA is simple to use and the Analysis of Variance technique is very useful, there are many other tests and software packages that may be better suited to your situation. In fact, you can find free implementations for most statistical tests these sites: John Pezzullo's Interactive Statistics and Free Software pages. | ||||||||||||||||||||||||||||||||||||||||||||||||||||||||||||
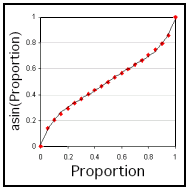
| Arcsin |
|
||||||||||||||||||||||||||||||||||||||||||||||||||||||||||||
| Between-subject design | Also called a 'completely randomized design'. Each participant is only involved with one condition of the experiment. Compare to within-subject designs. | ||||||||||||||||||||||||||||||||||||||||||||||||||||||||||||
| CI95% | The confidence interval (CI) predicts the location of the population mean. For example, an observed mean of 12 with a CI95% of 2 means that the we believe there is a 95% probablity that the population mean lies between 10 and 14. Confidence intervals are useful error bars for graphs, as they give the viewer a sense of the variability for each mean. The CI is calculated with the formula CI = T * (SD / sqrt(N)), where SD is the standard deviation, N is the number of observation and T is the t-value with a given probability of p lying beyond it. For example, if we have 8 observation (degrees of freedom = 7), then t for .025 is 2.365. Note we use for CI95% we use a t-value of .025, as the confidence interval extends to 47.5% above and 47.5% below the mean. See nCI95% for how the CI95% values can be adjusted based on group variability. One can either compute separate confidence intervals for each condition, or compute a single global confidence interval. My software generates a single global confidence interval, as suggested by: | ||||||||||||||||||||||||||||||||||||||||||||||||||||||||||||
| Data transform | ANOVA and other parametric tests (such as the t-test) assume the data is normally distributed (a 'bell shaped curve'), with many scores near the mean and relatively fewer scores far above or below the mean. However, data is often 'skewed', and this can cause problems. A common rule of thumb is to apply a data transform if the zSkew of the data is greater than 1.96 or less than -1.96. The type of transform applied depends on the level of the skew. ezANOVA allows you to apply the reciprocal, log, sqrt, and arcsin transforms. To apply a transform, select the desired formula from the 'Transform' item of the 'Data' menu. | ||||||||||||||||||||||||||||||||||||||||||||||||||||||||||||
| Factor | A 'factor' is a category of independent variable. For example, in the within-subjects example above the noise of the room we place the participants into is a factor (in this example the factor has three levels: the rooms are either silent, have classical music or have rock music). Each factor must have at least two levels (e.g. we need to compare one setting to another). | ||||||||||||||||||||||||||||||||||||||||||||||||||||||||||||
| Fixed Effects Model | The ANOVAs computed by ezANOVA assume a fixed effect model, which means that the inference drawn is specific to the levels you have entered into your analysis. This can be contrasted to a random effects model where the levels are randomly selected from a larger population of levels and we want to make inferences about that general population. For a more detailed discussion, see Kirk (1982). The Wikipedia includes a description of these models. . | ||||||||||||||||||||||||||||||||||||||||||||||||||||||||||||
| Homogeneity of variance | In addition to assuming that your data is normally distributed (not skewed), ANOVA also assumes the the variance between conditions is similar. Violating this assumption will reduce your statistical power (you will be less likely to detect differences between your conditions). Therefore, ANOVA tends to fail gracefully: it becomes more conservative if this assumption is broken rather than causing false alarms. | ||||||||||||||||||||||||||||||||||||||||||||||||||||||||||||
| Level | A level is a setting of the independent variable. Each factor of a study has at least two levels. For example, in the within-subjects example above experiment has three levels: the participants are in rooms that are either silent, have classical music or have rock music. | ||||||||||||||||||||||||||||||||||||||||||||||||||||||||||||
| License |
ezANOVA, Copyright (c) 2007 by Chris Rorden. All rights reserved. Redistribution and use in source and binary forms, with or without modification, are permitted provided that the following conditions are met:
|
||||||||||||||||||||||||||||||||||||||||||||||||||||||||||||
| Log | The log data transform is used when our data is substantially skewed (e.g. a zSkew in the range 2.33..2.58). We apply an inverse log if the data is substantially negatively skewed (zSkew in the range -2.33..-2.58). For example, the log transforms of the values 10, 100, 1000 are 1, 2, 3 respectively | ||||||||||||||||||||||||||||||||||||||||||||||||||||||||||||
| Mean | The mean is a measure of the central tendency (average) of a distribution. With this software 'mean' refers to the arithmetic mean of a distribution (the sum of all values divided by the number of values). So the mean of 6, 10, 12, 14 is equal to 10.5. | ||||||||||||||||||||||||||||||||||||||||||||||||||||||||||||
| Mixed design | Also known as a 'split-plot' design. An ANOVA where at least one factor is a between-subject factor (with different individuals in each level) and at least one factor is a within-subject factor (with the same individal participating in each level). | ||||||||||||||||||||||||||||||||||||||||||||||||||||||||||||
| Multiple Comparisons | As we conduct many statistical tests, we are increasingly likely to make at least one false alarm. Therefore, during multiple comparisons, our familywise error (FWE) rate increases. If we conduct 20 tests, each with a 1/20 (p<0.05) criterion, we will on average make one acidental false alarm (reporting an effect that is actually due to random chance). If we compute many unplanned pairwise comparisons, we can use the TukeyHSD to try to control for the rise in familywise error. Alternatively, we can apply Bonferroni correction to our t-tests (e.g. if we want to compute 10 tests with an overall 0.05 chance of a false alarm, we should use (0.05)/10 = 0.005 as our critical cutoff value. | ||||||||||||||||||||||||||||||||||||||||||||||||||||||||||||
| n | The number of values that compose a distribution. | ||||||||||||||||||||||||||||||||||||||||||||||||||||||||||||
| nStDev, nCI95%, nSE, nVar | When ezANOVA computes the variability measures for repeated-measures
designs, it removes the variability that can be
explained by knowing which subject is being tested. This
resulting value is referred to as the normalized
values, e.g. nCI95%. The raw CI95% is not very meaningful
in repeated measures designs, as it combines both within
and between subject variability. Therefore, the nCI95% is
more appropriate for error bars when you graph repeated
measures data. For details:
Below is an example of this technique. Consider a study where we measure the speed of typing for different individuals. Each person is tested in a noisy and quiet room (our independent measure). The dependent measure is the words per minute the people type. The raw data might look like this:
Some people are better typists than others, so between subject variability is a major contributor to the scatter reported by the standard deviation. However, consider if we adjust each individual's observations so their scores are standardized to the grand mean of 57 words per minute (shown in blue, above). Anna types an average of 60wpm, so we will reduce each of her scores by 3. Alex types approximately 4wpm slower than the grand average, so we will increase her scores by 4. Finally, Alex types at 58wpm, so we reduce her scores by 1. The table below shows the effect of this correction: the overall grand mean (57), silent mean (61) and noisy mean (53) remain the same, but the normalized Standard Error now only measures the within subject variability, and therefore gives a more accurate measure of the variability as measured by a repeated measures test (also note that normalized values are identical across conditions):
|
||||||||||||||||||||||||||||||||||||||||||||||||||||||||||||
| Q | See TukeyHSD | ||||||||||||||||||||||||||||||||||||||||||||||||||||||||||||
| Reciprocal | The reciprocal data transform is used when our data is severly skewed (e.g. a zSkew > 2.58). We apply an inverse reciprocal if the data is severly negatively skewed (zSkew < -2.58). For example, the log transforms of the values 10, 100, 1000 are 0.1, 0.001, 0.0001 respectively. Note this transform flips the direction of the values, so you need to bear this in mind when interpretting results | ||||||||||||||||||||||||||||||||||||||||||||||||||||||||||||
| Repeated-measures design | See within-subject design. | ||||||||||||||||||||||||||||||||||||||||||||||||||||||||||||
| SE | Like variance (Var) and standard deviation (StDev), the Standard Error (SE) is a measure of the variability of the data (the spread of the distribution). Standard Deviation gives us a measure of the variability of single observations. On the other hand, Standard Error is a measure of the variability of the mean. Since ANOVA and t-tests look for differences in the mean in different conditions, the SE is usually a meaningful value to use for error bars, reflecting the variability in the estimate of the mean. The SE is simple to calculate: SE = SD/sqrt(N), where N is the number of observations and SD is the standard deviation. Another estimate of the variability of the means is the Confidence Interval (CI95%). See also nSE. | ||||||||||||||||||||||||||||||||||||||||||||||||||||||||||||
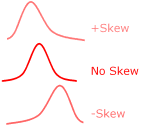
| Skew |
|
||||||||||||||||||||||||||||||||||||||||||||||||||||||||||||
| Sphericity | Repeated measures ANOVAs assumes the variances of the differences between the repeated measurements should be approximately the same. This is referred to as sphericity. This only affects within-subject factors with at least three levels. In theory, if this assumption is breached, the ANOVA can become liberal (generating false alarms). This is unlike other ANOVA assumptions where violations make the test conservative (failing to detect real findings). ezANOVA can measure the covariance and reports Greenhouse-Geisser as well as Huynh-Feldt corrections, as described by Kirk (1982). Baron includes a nice description of sphericity and these corrections. An alternative to the repeated measures ANOVA or the MANOVA are Mixed Effects models which are not adversely influenced by sphericity. Furthermore mixed effects models handle empty cells (e.g. missing datapoints) better than ANOVA. A clear article regarding this alternative is Bagillla et al.'s (2000) Mixed-effects models in psychophysiology, Psychophysiology, 37, 13-20. On the other hand, for balanced designs, Restricted Maximum Likelihood (REML), maximum likelihood (ML) and Least squares Lehmann-Scheffe (LSLS) techniques actually all report identical values to the uncorrected ANOVA. While this equivalency has not been mathematically proved, it strongly suggests that the computationally simpler ANOVA method is in fact perfectly valid for balanced designs. | ||||||||||||||||||||||||||||||||||||||||||||||||||||||||||||
| Split-plot design | See mixed design. | ||||||||||||||||||||||||||||||||||||||||||||||||||||||||||||
| Sqrt | The square root (sqrt) data transform is used when our data is moderately skewed (e.g. a zSkew in the range 1.96..2.33). We apply an inverse sqrt if the data is substantially negatively skewed (zSkew in the range -1.96..-2.33). For example, the sqrt transforms of the values 10, 100, 1000 are 3.16, 10, 31.6 respectively | ||||||||||||||||||||||||||||||||||||||||||||||||||||||||||||
| StDev | The "Standard Deviation" is a measure of the variability in a distribution. It is equal to the square root of the variance. When the StDev is small, most of the data has scores very close to the mean. With larger StDev's, there is much more spread in the scores. | ||||||||||||||||||||||||||||||||||||||||||||||||||||||||||||
| t | see t-test | ||||||||||||||||||||||||||||||||||||||||||||||||||||||||||||
| t-test | A 'pairwise comparison' used to directly test two conditions. Note that this test does not automatically adjust for multiple comparisons. | ||||||||||||||||||||||||||||||||||||||||||||||||||||||||||||
| Tukey HSD | Tukey's Honestly Significant Difference test is a pairwise comparison that attempts to control for multiple comparisons. computes a standardized Q score. | ||||||||||||||||||||||||||||||||||||||||||||||||||||||||||||
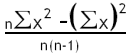
| Var |
|
||||||||||||||||||||||||||||||||||||||||||||||||||||||||||||
| Within-subject design | Also known as repeated measures designs, these use
the same individuals for all conditions of an experiment.
For example, in the example above we have the same
individual type in three rooms with different music
(none, classical or rock). These designs can
substantially reduce the variability in your data. There
are three facts that must be noted:
|
||||||||||||||||||||||||||||||||||||||||||||||||||||||||||||
| zSkew | Z-Score of the skew is used to see if data transformation is required. Typically, one should be wary of conducting an ANOVA if the zSkew for any condition is outside the range -1.96..1.96. The zSkew is calculated by dividing the Skew by the Standard Error of the Skew. SEskew is typically computed as the square root of 6 divided by n. |
 |