Maps
of Rocky Branch Watershed
 Click on images
for larger view.
Click on images
for larger view.
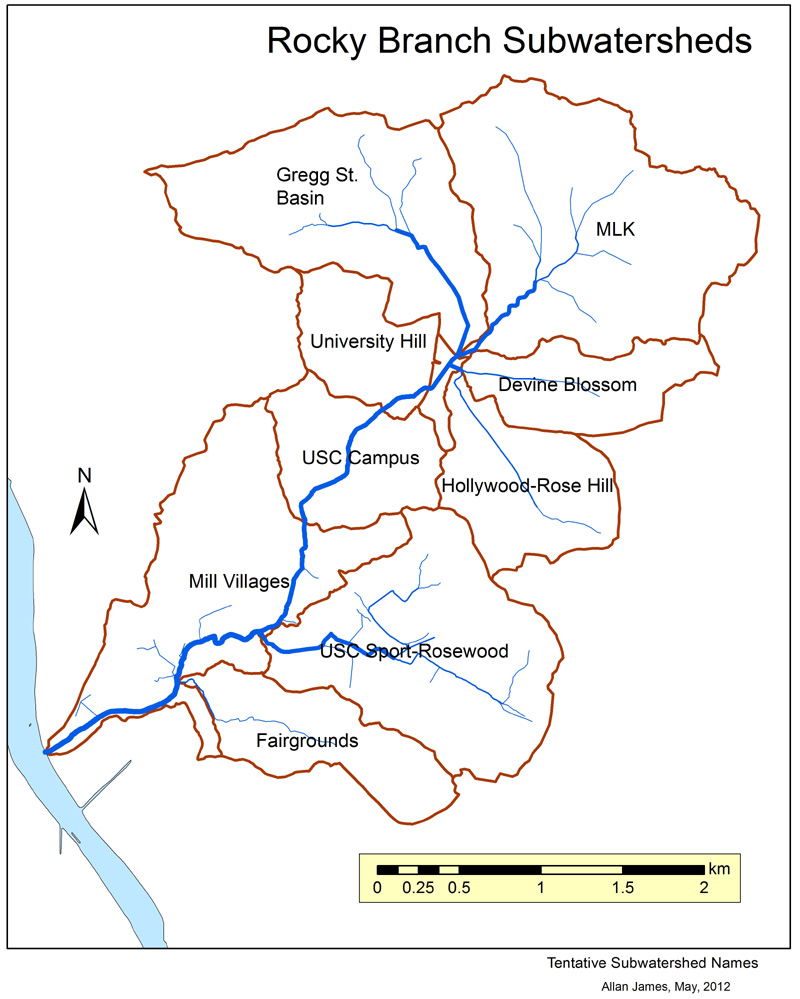
Maps
of RB subwatersheds derived from high resolution LiDAR topographic data.
These divides are tentative and will change as the storm sewer system is
mapped. An example of such changes for the USC Subwatershed
is provided below Subwatershed names were tentatively
assigned by the RBW Alliance technical board .
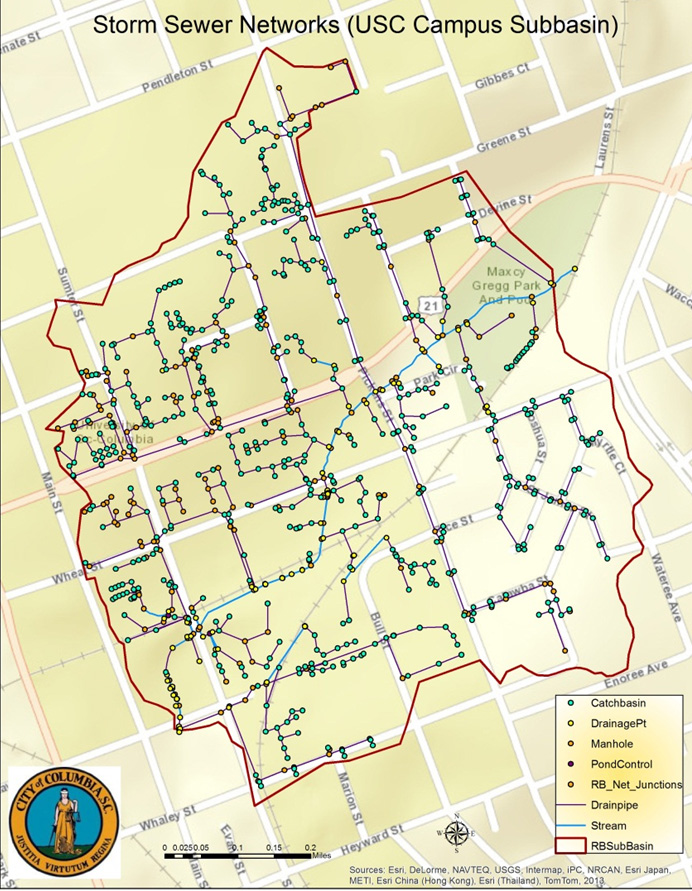 Map of municipal separate storm sewer system (MS4) for the USC subwatershed. Map data were derived
from digital data from City of Columbia (CoC), building
plans, and field work. Source: City of Columbia;
Jingting Sun, 2013.
Map of municipal separate storm sewer system (MS4) for the USC subwatershed. Map data were derived
from digital data from City of Columbia (CoC), building
plans, and field work. Source: City of Columbia;
Jingting Sun, 2013.

Revised map of subwatersheds applying changes to USC subwatershed based
on MS4 (storm sewer) map. The divide
between the USC and University Hill watershed shifted because storm sewers cut
across the drainage divide. This shows
the importance of mapping the storm sewer system. Storm sewers carry flood runoff, toxins, and
pollution and knowing the direction of these flows is essential to hazards assessments,
emergency management, modeling, and maintenance.
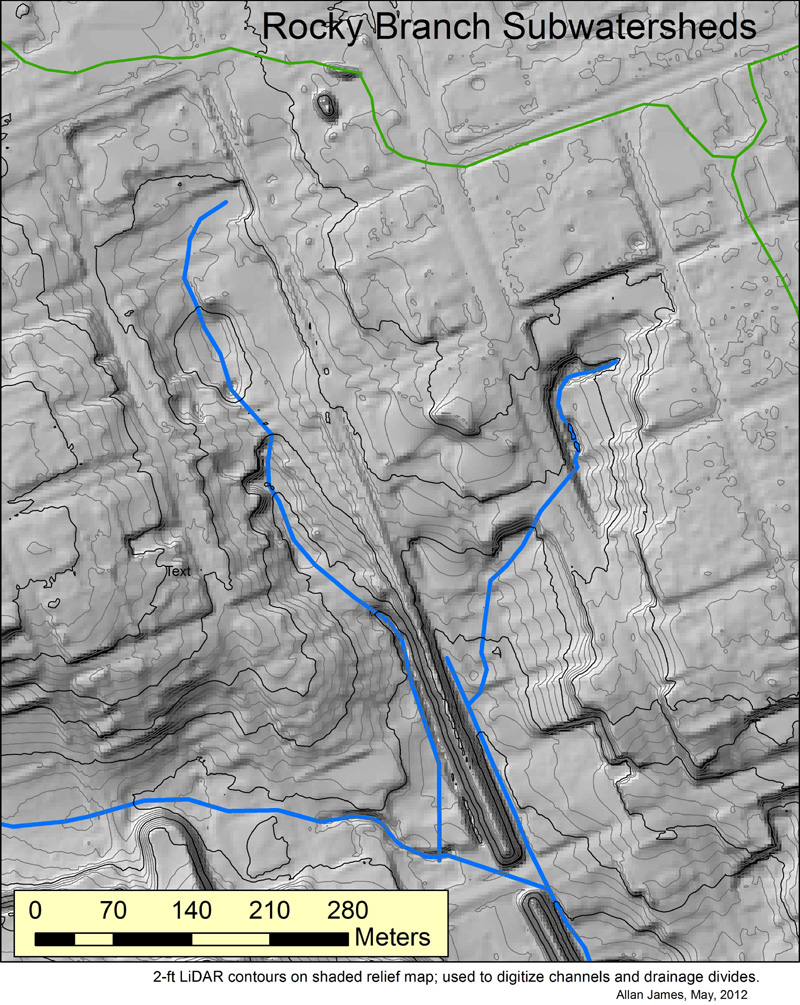
 Shaded
relief maps of upper RBW with contour lines of equal elevation,
based on 2010 LiDAR topographic data. Stream channels (blue) and drainage divides
(green) were manually interpreted from the shaded topographic map. Divides and channels need to be verified.
Shaded
relief maps of upper RBW with contour lines of equal elevation,
based on 2010 LiDAR topographic data. Stream channels (blue) and drainage divides
(green) were manually interpreted from the shaded topographic map. Divides and channels need to be verified.
Left: upper RBW from Maxcy
Gregg Park (at bottom) to Gregg St. (upper left) and MLK (upper right) subwatersheds.
Below: Gregg St. subwatershed
between Gervais and Taylor Streets.
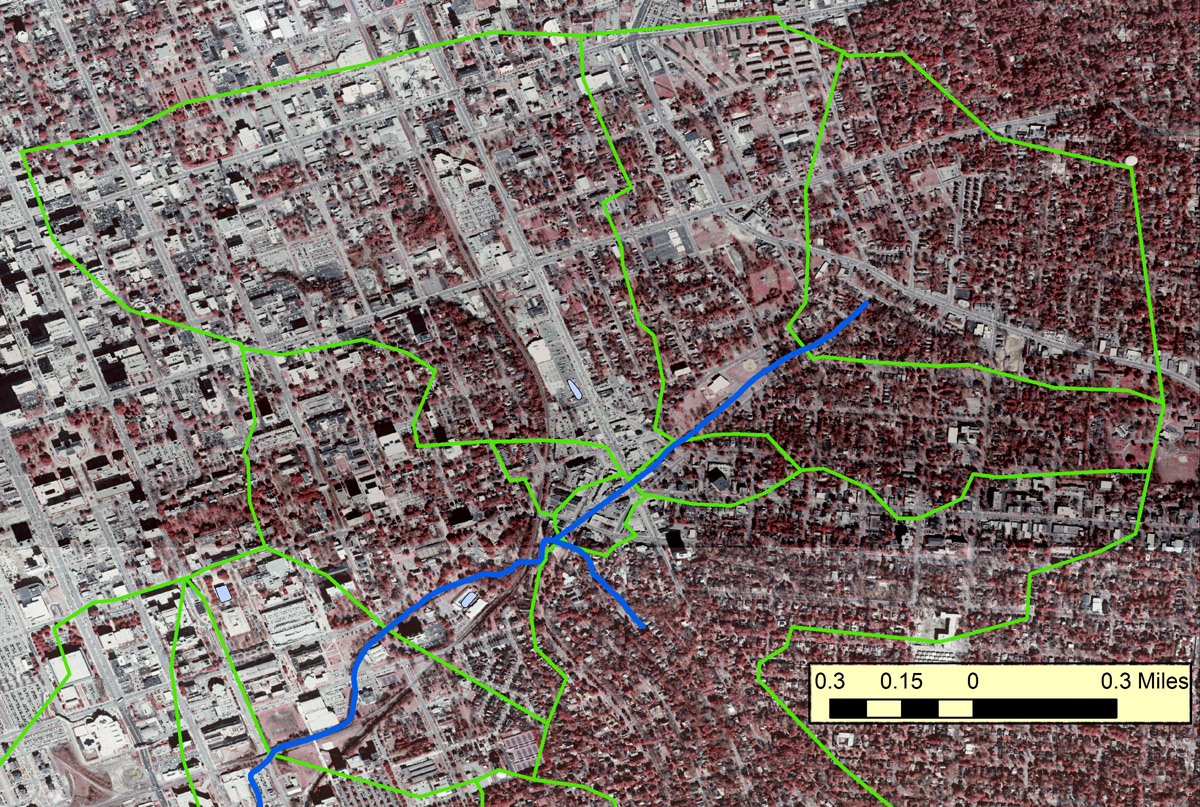 Satellite image of upper RBW. Subwatershed
divides (green) are from Wooten (2008) and differ from those above. Zooming in
on the image can reveal parks, vegetation, roads, buildings, etc.
Satellite image of upper RBW. Subwatershed
divides (green) are from Wooten (2008) and differ from those above. Zooming in
on the image can reveal parks, vegetation, roads, buildings, etc.
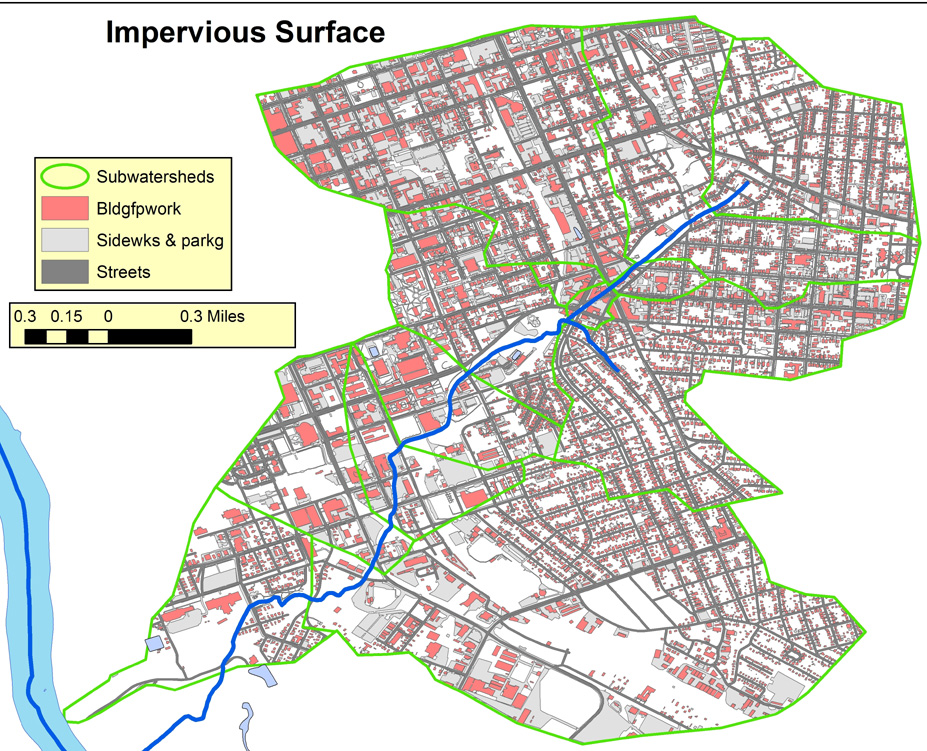 Impervious surfaces in
RBW. Buildings, parking lots, parking
garages, roads, and sidewalks combine to form a large area of impervious surfaces
that summed to ~49% of the RBW in 2007 when mapped. These
areas do not allow infiltration of rainfall, so they generate large flood
volumes and pollution. Source: John Wooten (2008).
Impervious surfaces in
RBW. Buildings, parking lots, parking
garages, roads, and sidewalks combine to form a large area of impervious surfaces
that summed to ~49% of the RBW in 2007 when mapped. These
areas do not allow infiltration of rainfall, so they generate large flood
volumes and pollution. Source: John Wooten (2008).
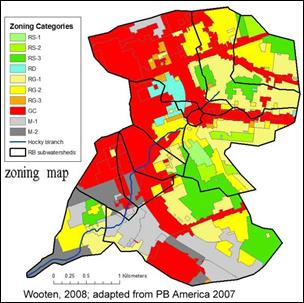 Zoning in the RBW. Wooten (2008) merged Columbia
and Richland County zoning maps for 2007 for comparisons with impervious
surfaces. This map shows the variety of
land uses in RBW, including commercial lands along major road corridors, an industrial
belt in the south, and a variety of residential land uses. Source: John Wooten (2008).
Zoning in the RBW. Wooten (2008) merged Columbia
and Richland County zoning maps for 2007 for comparisons with impervious
surfaces. This map shows the variety of
land uses in RBW, including commercial lands along major road corridors, an industrial
belt in the south, and a variety of residential land uses. Source: John Wooten (2008).
Last Modified: 5/15/2013 Allan James (AJames@sc.edu)