Geography 202 Lecture Exercise 3
Due:
Digitally on Blackboard by Thursday, April 3
20
points
The Task
Use
the Storm Prediction Center web site to write a report on severe weather. <http://www.spc.noaa.gov/exper/archive/events/>
Your Event
You should use the date listed next to your name below:
Abby: April 26, 2011
Alison: April 10, 2009
Austin: May 29, 2008
Becca: May 23, 2008
David:
February 10, 2013
Emily:
March 15, 2008
Hannah: June 20, 2011
Holly: June 11, 2008
Jalen: May, 22, 2011
Jessi: April 22, 2010
Marshall: June 12, 2008
Melaina: June 4, 2008
Nathan: February 5, 2008
Veronica: May 20, 2013
Alternate: March 2, 2012
Submission
Create one file that contains all graphics and text. Name the file “SvrWx_Smith” (where the “Smith” part is your last name). By Thursday, April 3, please submit this file on Blackboard by navigating to the “What’s New” frame that includes “Assignments”. Click the “Severe Weather” link there to upload your file.
Requirements
of your report
Your report should contain answers to the questions below, and the following graphics:
a. one map showing where severe weather occurred
b. one surface weather map on the day when severe weather occurred
c. one upper-air map (in the lower 2km) coincident the surface map
d. one upper-air map (at or above 500-mb) coincident with the surface map
e. a skew-T graph for the same time as the upper-air maps. Be sure to pick the right station and time!
Answer the questions below in your report. Be sure that the weather maps that you examine are for approximately the same time as the storms occur. Please describe what map or other resource you used to answer each question by simply referring to it (e.g. “The skew-T chart shows that temperature……..” or “We see on the 500-mb map that…….”)
1. Where did the storms occur with respect to features like a mid-latitude cyclone or fronts on the surface map?
2. How did the air flow in the lowest 1 km influence the storms?
3. How did the air flow in the upper-troposphere influence the storms?
4. How did the vertical temperature profile contribute to the severe storms? (Be sure to choose a skew-T chart from a location near the storms. Also note that the 00z maps are often better than 1200z maps, because they show early evening conditions when most storms occurred, rather than early morning conditions.)
5. How did the wind shift with height near the storms, and how did this contribute to their development?
Skew T diagram
The thermodynamic diagrams at the Storm Prediction Center display plots of temperature (red), dew point temperature (green), and wind speed (kt)/direction with respect to pressure. Pressure is denoted by the black horizontal lines (labeled on left in mb), and isotherms are "skewed" as dashed pink lines from lower left to upper right (labeled on bottom in degrees C). Unsaturated parcel ascent is represented by the solid pink curves from lower right to upper left (dry adiabats), and saturated parcel ascent is represented by the dashed brown curve emanating from the most unstable parcel level. The environmental wet bulb temperature profile (i.e., the temperature that would result from evaporational cooling of each level to saturation) is plotted in dark cyan between the temperature and dew point traces. The effects of ice processes or water loading in saturated ascent are not accounted for in this diagram.
Levels above ground level are plotted for reference in red along the left side of the diagram, while the surface parcel height (m) above mean sea level is plotted in parentheses. Also, the freezing line (0°C) and the -20°C isotherm are highlighted in dark blue.
For
help with additional information on the SPC web page go to: <http://www.spc.noaa.gov/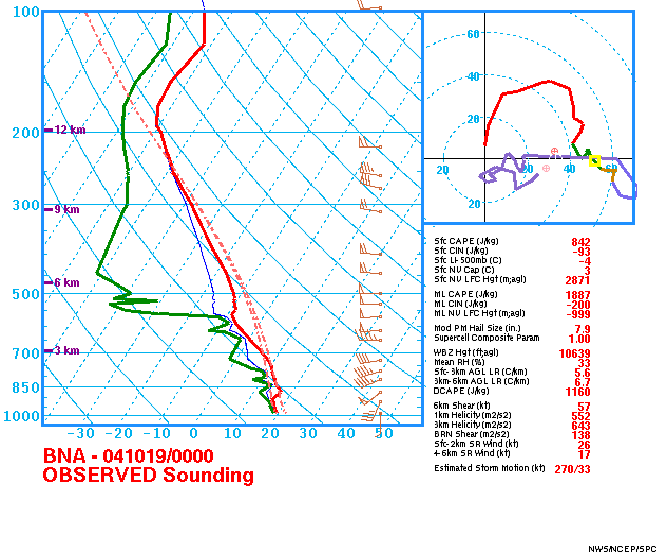 exper/soundings/help/index.html>
Resources:
Most
of the maps you need can be found at: < http://www.spc.noaa.gov/exper/archive/events/>
Other
potentially useful sources:
http://www.hpc.ncep.noaa.gov/dailywxmap/index_20030101.html (surfc and upper-air maps)
http://weather.uwyo.edu/upperair/sounding.html (upper-air soundings; choose Type of plot: “GIF: Stuve”)
http://www.hpc.ncep.noaa.gov/html/sfc_archive.shtml (archive of surface observations)
http://vortex.plymouth.edu/sfccalc-u.html (general surface temperature, dew point, etc. maps)
http://squall.sfsu.edu/crws/archive/satimgs_month_arch.html
http://vortex.plymouth.edu/upcalc-u.html
(upper-air only)
http://weather.unisys.com/archive/index.html
(Unisys archive)