 |
Sample fMRI Block Design Analysis using SPM |
Background
This tutorial describes how to analyze a simple fMRI dataset. To complete this tutorial you will need:
- MATLAB installed on your computer.
- SPM installed on your computer.
- Download and extract the sample dataset that includes the fMRI data (in NIfTI format), an anatomical scan (also T1) and text files that describe the timing.
Consider a simple experiment where we ask an individual to press their left hand at some timepoints, their right hand at other times, and to simply rest at other moments in time. In this situation one would expect that the left motor cortex and right cerebellum will be activated following right hand movement. This tutorial shows how to analyze this dataset. Below we provide a sample dataset from the GSU/GT Center for Advanced Brain Imaging.
The image below illustrates our study. The vertical axis shows time, in 1.92 second fMRI volumes (the picture shows the first 6 minutes). The red and green bars along the top of the image show when the individual presses their left (red) or right hand (green) - note that they press the same hand continuously for 12 seconds (a 'block' design). The red and green lines show the predicted blood flow signal for regions that are activated following left and right hand movements. Note that we expect the images to become brighter several seconds after an individual starts a task (the blood flow effect is sluggish).
Analyzing the dataset
- First, start Matlab
- from the Matlab command prompt, change to the directory where your data is, e.g. 'cd c:\tutorial' or 'cd "\my documents\tutorial"'
- from the Matlab command prompt, launch SPM8 by typing "spm fmri" (or at the CABI where you can run different version of SPM, choose "spm8"). If SPM does not launch, make sure you have downloaded SPM and it is in your Matlab path.
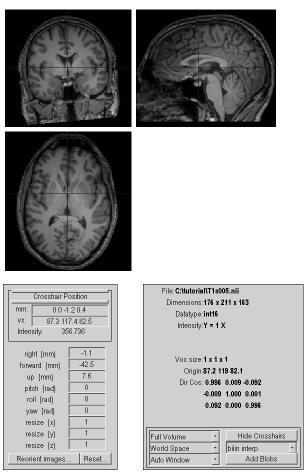
- Setting the origin: SPM's normalization does a great job of aligning brains from different people, but it is pretty sensitive to the origin used as an initial alignment betweent he image and the template. By default, scanners set the origin to be the center of the scanner, whereas SPM expects this to be the anterior commissure. It is often helpful to set your origin before processing. If you are not familiar with the anterior commissure, see my web page
- Lets set the origin. From SPM's menu window, press the "Display" button and select your highest resolution image (in the tutorial, T1s005 is our high resolution T1-weighted image).
- Images of this image are shown, you can click on the image to change the crosshair position.
- Press the thin button under "Crosshair Position to move the cursor to the origin (the "mm" field will be set to 0 0 0).
- Adjust the "right (mm)", "forward (mm)" and "up (mm)" so the crosshairs point to the AC.
- Choose the "reorient images" button and apply these translations to all our raw images. If we only shift the T1 image, it will now be out of alignment with the others. As long as you have not processed any images, only the raw images are in our folder, so it is easy to select all the images. The right hand column shows the images in your folder. As you select each image, it appears in the bottom column. Select all the images: DTI30s001, Fieldmaps006, Fieldmaps007, T1s005, fmriblocks009, fmrievents008.
- FMRI scans usually have spatial distortions that can be minimized by using a field map to measure field inhomogeneities and then djusting the fMRI data. The tutorial data includes fieldmaps data if you want to do this, but that is beyond the scope of this tutorial. If you want to do this, take a look at my fieldmap web page. For our fMRI data, the readout time was 16.96ms (echo spacing = 0.54ms, 32 lines [interpolated to 64 using GRAPPA r=2]), and the fieldmaps used echo times of 4.92 and 7.38ms.
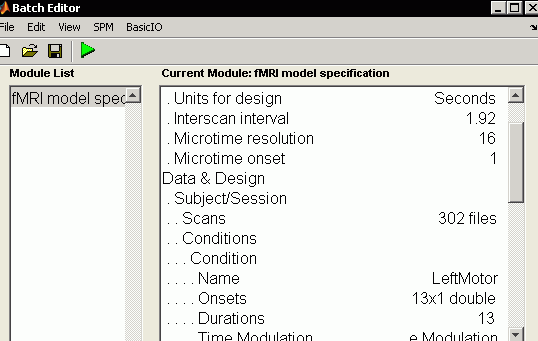
- From the main SPM menu window, press the "Batch" button
- A new window appears showing the Batch editor. We will use this for a while...
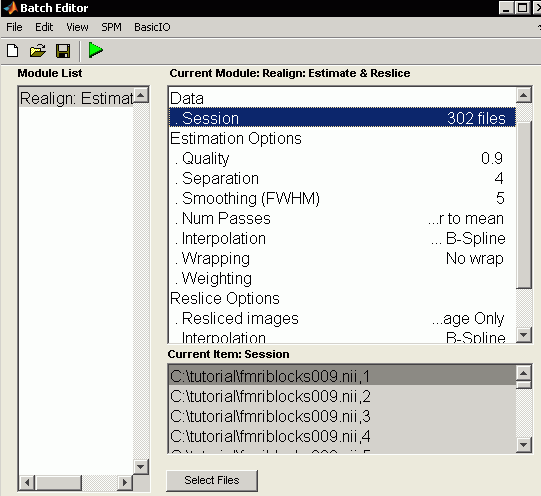
- Choose the menu item SPM/Spatial/Realign/Realign:Estimate & Reslice from the Batch window. A new set of items appear to refine our motion correction:
- Click on the "Data" node and choose "new session"
- Click on "Session" and press the "Select Files" button. We want to select all 302 images from our 4D fMRI data named "fmriblocks009.nii". An easy way to do this is to set the text filter (the edit box near "Filt") to read "^fmribl*.*" and then set the text in the line below that to read "1:999". Press return and you should be able to select all 302 images in the right column (order is important - click the first volume and then shift-click the 302nd). Once selected the image appear in the lower panel. Press done to select these files. Make sure you have selected 302 images.
- Reslice Options, Resliced Images: "Mean Image only" - motion transforms stored in file "rp_fmriblocks009.txt" which lists translations and rotations. Therefore, not saving indvidual images is faster, uses less disk space and includes one less interpolation.
- Press green Go button and wait for SPM to complete.
- Click on the item "Realign" in the Module List and choose Edit/DeleteModule.
- We could do slice timing correction (especially for event related designs) SPM/Temporal/SliceTiming. However our TR is pretty fast so the slice timing error is small and should be largely explained by the temporal derivative.
- Our T1 data is higher resolution and has better gray matter tissue contrast than our fMRI scan. Therefore, it is common to use the function in SPM's batch window SPM/Spatial/Coreg/CoregEstimate to compute how to align the mean realigned fMRI data to the T1 image, and then to apply these transforms to all the fMRI images. If this was selected, we would choose the T1 image in the subsequent normalization (and the T1 template). Here I will normalize the low resolution fMRI data directly. There are pros and cons for each method, but that is beyond the scope of this tutorial.
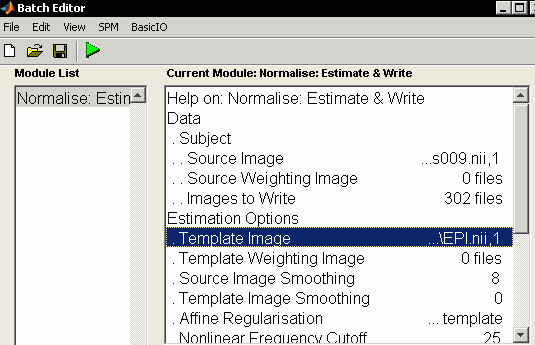
- Lets normalize our data. From the Batch window, select SPM/Spatial/Normalise/NormaliseEstimate&Write
- Data: Click new subject", and set the following items for the new subject node
- Select "Source Image" and press "Select Files" choose the "meanfmriblocks009.nii created during the realignment we have previously described.
- Select "Images to write" and click "select files". As before, set the filter to "^fmribl*.*" and the line below to "1:9999" make sure to select all 302 files
- Slect "Template Image" and press "Select Files" - choose the template "EPI"
- Press green Go button and wait for SPM to complete.
- Click on the item "Normalize" in the Module List and choose Edit/DeleteModule.
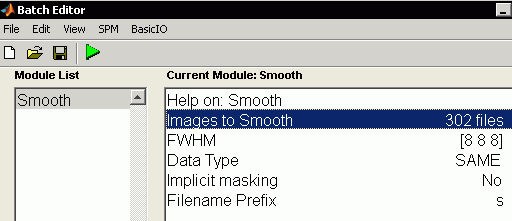
- Now we blur our data with a gaussian. From the Batch window, select SPM/Spatial/Smooth
- Select "Images to smooth" and press select files, set the filter to "^wfmribl*.*" (note 'w' prefix, as we want the images warped by normalization) and set the line below to "1:999" to allow us to select all 302 images.
- Note we will keep the default 8mm full width half-maximum smooth.
- Press green Go button and wait for SPM to complete.
- Click on the item "Smooth" in the Module List and choose Edit/DeleteModule.
- Now we are ready to set up our statistics. From SPM's main window, press the "Specify 1st-level"
-
Click on "Directory" and press "Select Files", choose ".\" in the right column and press Done.
- Lets set Timing Parameters
- Units for design: Seconds
- InterscanInterval: Choose Edit value and enter your repeat time (TR) in seconds: 1.92
- Lets describe the Data & Design
- Press "New Subject/Session"
- In the new Subject/Session node that is created select "Scans" and press "Select Files". Set the filter to "^swfmribl*.*" (note 'sw' prefix, as we want the smoothed warped images) and the line below should be set to 1:999. Make sure to select all 302 volumes.
- We need to specify our conditions. On some blocks the participant pressed their left hand for thirteen seconds, on others the right hand was moved.
- Select "Conditions" and press "New: Condition" twice.
- For the first "Condition" node:
- Name: set to "LeftMotor"
- Select Onsets and press "Edit value" and enter the times when blocks of left hand movements started: "0 52.797 105.594 158.406 211.203 264 265.094 316.797 369.594 422.406 475.203 528 529.094"
- Durations: press Edit value and enter 13. We will model each hand movement as a 13 second long impulse
- For the first "Condition" node:
- Name: set to "RightMotor"
- Select Onsets and press "Edit value" and enter the times when blocks of left hand movements started: "26.406 79.203 132 184.797 237.594 290.406 343.203 396 448.797 501.594 554.406"
- Durations: press Edit value and enter 13. We will model each hand movement as a 13 second long impulse
- For event related designs we would choose BasisFunctions/CanonicalHRF/ModelDerivatives and select "Time Derivatives"
- Since we have a block design, with 13-second long periods of activity, we can think of our model as a sine wave with a period of 26seconds (13s on, 13s rest), so we will specify a High-pass filter of 52s (twice the period, as these filters have some roll-off). For event related designs we would tend to keep a value in the range of 100-128s
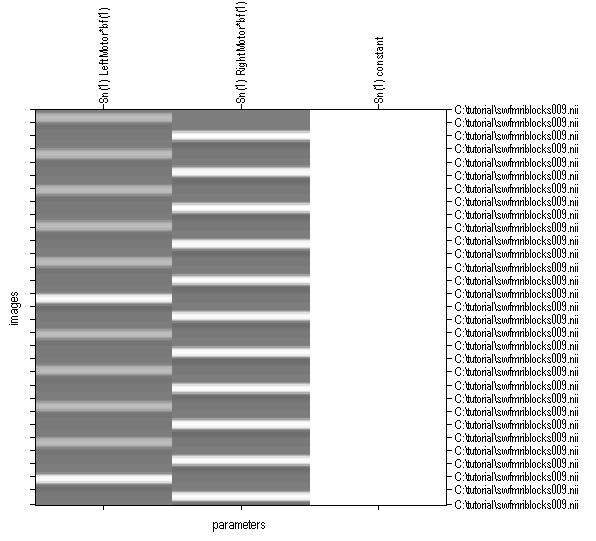
- Press green Go button and wait for SPM to complete.
- SPM will graphically show our model. Here there are two columns, corresponding to when the individual moved their left and right hand. The 302 images are shown as the vertical axis, with time starting at the top. The white bands show periods where we expect brain regions involved with that task will be especially bright. Our statistics will see which brain areas fit these predictions.
- Now we can look at our results. From SPM's main window, press the "Results"
- You will be asked to select a design, choose the "SPM.mat" we just created and press Done.
- A new window called contrast manager appears. We will want to specify 5 contrasts
- Press "Define new contrast"
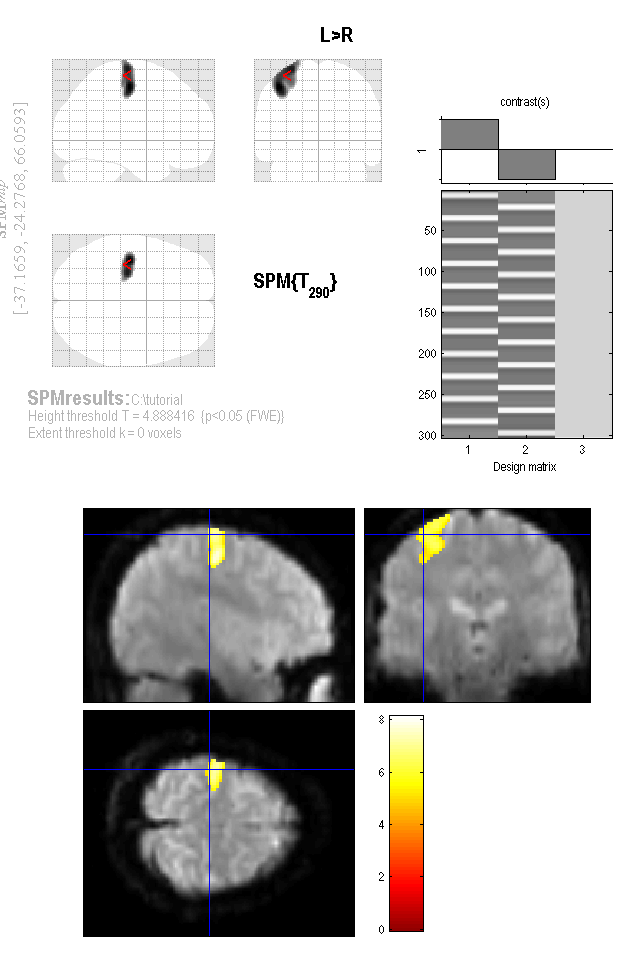
- Set Name to "L>R"
- Set type to "t-contrast"
- Set contrast to 1 -1
- press OK
- Press "Define new contrast"
- Set Name to "R>L"
- Set type to "t-contrast"
- Set contrast to -1 1
- press OK
- Press "Define new contrast"
- Set Name to "L>"
- Set type to "t-contrast"
- Set contrast to 1 0
- press OK
- Press "Define new contrast"
- Set Name to "R>"
- Set type to "t-contrast"
- Set contrast to 0 1
- press OK
- Press "Define new contrast"
- Set Name to "L+R>Rest"
- Set type to "t-contrast"
- Set contrast to 1 -1
- press OK
- There are now 5 contrasts available in our contrast manager. Select the one you are interested in (e.g. "L>R") and press "Done"
- You will be asked if you want to mask the image. Click "none"
- You will be asked for a title, the default is your contrast name "L>R" select this and press enter
- You will be asked for the method to control for multiple comparisons. Click "FWE" (familywise error correction).
- You will be asked for a threshold, the suggested p <0.05 is fine
- You will be asked for a extent as a cluster threshold, the default of 0 is fine.
- A glass brain of your results now appears in the graphics screen. You can right click on the image and select functions - lets try the "go to global maximum"
- The lower left has a lot of options to control the diplay. Lets explore our data.
- In the "Display" column, select the "overlays..." pulldown menu and choose sections
- You will be asked to select an image, lets choose the first volume of our normalized data wfmriblocks009.nii
- A new set of views appears. Click to inspect different regions.
- In the "p-values" column, select the "whole brain" button
- A table of active areas appears.
- Clicking on the mm column of each row highlights that cluster's location in the glass brain.
- Right click and choose "print text table" - the table appears in the Matlab command line so you can copy it to your manuscripts.
![[Image: Model Timecourse]](images/block/timecoursesmall.png "Sample timecourse.")