| MRIcro FAQs - Tips & Tricks |
This page is composed of questions from MRIcro users. I hope my answers will help other users:
Q: When MRIcro converts medical images (DICOM, GE, Elscint, etc) to Analyze format, is any image data lost?
A: MRIcro's image converion is lossless. For example,
DICOM 8-bit images (with values 0..255) will be saved as Analyze
8-bit images, and DICOM 16-bit images (with values ranging from
-32768..32767) will be saved as Analyze 16-bit images. Therefore,
the raw data is identical. However, it is worth noting that the
headers of medical images often include a function to calibrate
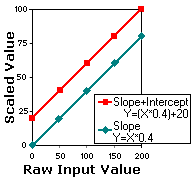
the raw data. Consider a 8-bit DICOM image with voxel intensities
ranging from 0..200 (see figure below). The header might specify
a function such as "Y = (X*0.4)+20". In this case, a
voxel with a raw value of 200 will have a scaled value of 100
[=(200*0.4)+20]. In this example, the header specifies a slope
(0.4) and a X-intercept (20). While DICOM headers can specify
both a slope and an intercept, SPM99/MRIcro (pre-1.36) headers
can only specify a slope (this is the 'scale' value in MRIcro's
"Header Information" panel). Therefore, if the
hypothetical DICOM images were converted to Analyze format, the
scaling transform would become "Y=X*0.4", and our voxel
with a raw value of 200 would have a scaled value of 80. Note
that the intercept is merely a constant that is applied to all
values. For MRI scans (where brightness is relative), and data
analysis (where relative value and variance is crucial), the
constant is irrelevant. However, for CT scans (where counts are
often calibrated, e.g. Hounsfield units), it is worth bearing in
mind that image conversion may slightly different calibrated
voxel values. Again, you simply have to add the intercept value
to compute your image intensity. To find out the Intercept value
for a DICOM file, simply drag and drop the file onto MRIcro and
then choose 'Show/hide foreign header' and scan the header for
the value listed for group:element 0028:1052, e.g.
"0028,1052,Rescale Intercept: 0" suggests that the
intercept is zero. Update: MRIcro 1.36 and later preserve
the Intercept value (you can see and adjust this value by
choosing "Information" from the "Header" menu
and examining the "Zero Intercept" value. The intercept
is stored as a four-byte floating-point value in bytes 76-79 of
the header. SPM2 and later should also recognize this
information.
There are two exceptions.
Q: How can I convert 2D DICOM images into 3D DICOM images? (Convert a stack of slices into a single 3D image).
A: You can do this in two steps. First, convert your 2D DICOM images into a 3D Analyze format image. This ' batch processing' technique is described in my tutorial. Next, convert the new 3D Analyze image to DICOM format. To do this, open the Analyze image and choose 'Save As...' from the file menu. Next, press the 'Save DICOM' button. This will create a new, 3D DICOM image. However, it is important to point out that the new DICOM image will not have all of the header information of the original scan (e.g. patient name, scanner settings, etc, will not be included in this file). MRIcro creates generic DICOM files, that are designed to be read by other software, but does not necessarily include many of the standard DICOM header tags.
Q: How can I convert a stack of TIF [or BMP] files to Analyze format?
A: You can use ImageJ. For step-by-step instructions, see http://www.mricro.com/mricro.html#otherconv
Q: Do you know a way to transform SPMwin .vhd files into .hdr files so that they may be explored using your program?
A: SPMwin is a free implementation of SPM96 which runs on Windows. However, images created by SPMwin are not initially saved in the Analyze format. Here are three ways to convert SPMwin's *.vhd headers to Analyze format:
Q: I am searching for a simple, command-line driven DICOM-to-JPEG converter that runs in the Microsoft Windows (98/NT) environment. Basically a batch converter that will take DICOM files and convert them to JPEG.
A: My DCM2JPG application will do the trick (you can also rename it DCM2PNG or DCM2BMP to have it convert medical images to these other formats; the web page describes a number of other features). Irfanview can batch convert most DICOM images to common graphics formats (JPEG, PNG, GIF, etc). Irfanview expects DICOM files to end with the extension '.DCM'. You can rapidly change the extensions of many files by using freeware batch renaming programs. To batch convert images with IrfanView, use the 'Batch Conversion/Rename' function (in the File menu). Imagemagick can directly convert most dicom images to jpeg with a one line command and can be used around a simple shell/perl script for batches of files. Note that most JPEG algorithms use a lossy compression - so there is a tradeoff between file size and image quality. An alternative is to save your images in PNG format - a lossless compression scheme. DICOM2 can convert DICOM images to PNG format. A list of PNG viewers is available at: http://www.libpng.org/pub/png/pngapvw.html
Q: Why do Analyze format images appear upside down in MRIcro relative to ImageJ?
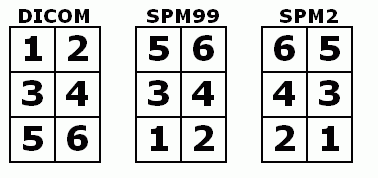
A: Most image formats (e.g. DICOM) describe data starting from the top-left corner and move from the top of the image to the bottom (much as English readers start at the top-left corner, reading each line from left to right). On the other hand, SPM96/SPM99/FSL expect image to be in RAS format (lines going from left to right, then posterior to anterior and finally inferior to superior). MRIcro automatically rotates Analyze images so they appear in the correct orientation. ImageJ (and several other programs) do not take this into account, so Analyze images appear upside down. If you rename MRIcro 'mr.exe', it will also (incorrectly) load Analyze images upside down, matching the output of programs like ImageJ.
 |
 |
Q: In my image the voxel size (in mm) varies across the different dimensions. Can MRIcro stretch the image so that voxels are proportionally the correct size?
A: Yes. A drop-down box in the slice viewer allows you to select how MRIcro displays anisotropic images. There are three modes: 'square', 'stretch' and 'smooth'. The square mode shows all voxels as square, regardless of the voxel size. The stretch mode proportionally stretches the coronal, sagittal and transverse slices (but not the projection views). Smooth mode proportionally stretches the image using a bilinear smoothing algorithm. MRIcro uses the size values in the header information panel to determine the relative size of voxels. The figure below shows a 1x4mm image shown using each mode.

| Q: My image the voxel size (in mm) varies across the different dimensions. The 'Smooth' and 'Stretch' features described in the previous question work unless I look at a free-rotate rendered view, where the image still seems to be squashed. The left panel shows what the image looks like, the right image shows what the image should look like. | 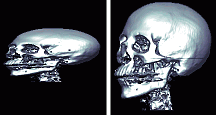 |
A: MRIcro assumes that voxels are isotropic (voxels are same size in each dimension) when generating rendered views. Adjusting for this would consume huge amounts of RAM, and I try to design MRIcro for everyone. However, MRIcro versions 1.35 and later can convert anisotropic images to be isotropic. First load the original image, and make sure that the 'Size [mm]' values of the 'header information' panel correctly describe your image. Next, select 'Convert anistropic image to isotropic' from the 'Etc' menu. This will create a new version of your image with isotropic voxels. If you open the new image, it will be rendered correctly. Note that this function uses bilinear smoothing and creates an 8-bit image, so there will probably be some loss of precision (i.e. do not do this for data you plan to use for SPECT/PET/fMRI analysis).
Q: MRIcro's Contrast Autobalance command (from the view menu) works well for MRI scans, but is not great for CT scans. How can I optimize the appearance of CT scans.
A: CT scans tend to have a very narrow contrast range. One nice thing about CT scans is that the intensity (Hounsfield scale) is pretty precise across images, while in MRI scans the values a relative. Basically, this means that you can view the CT images well if you precisely set the contrast.
Q: I want to extract the bone from a series of CT scans. How can I create regions of interest that use the same criterion across several images?
A: This makes sense for CTs, where image brightness is directly comparative across volumes. MRI brightness tends to be relative, so it is more difficult to quantify values. In addition, bone has a low signal in MRI scans, and therefore it can be difficult to distinguish bone boundaries.
Q: When I load multiple,
non-overlapping ROIs, they are all displayed as the same purple
color. Is there any way that I can have each ROI assigned to a
unique color?

A: This situation is illustrated in the figure above. Consider three separate ROIs: A,B,C. When you load multiple ROIs, the ROI color refers to the cumulative density of ROIs at a given point. In our example, the three ROIs share no common voxels, so each is represented as purple when all three ROIs are loaded simultaneously (ABC in the figure below). There is an easy way to make each ROI a unique color: make multiple copies of the ROIs. You can use the Windows file explorer to copy the files. For example, if our three files are A.roi, B.roi and C.roi, you will want tohave one copy of A (A.roi), two copies of B (B.roi, B2.roi) and three copies of C (C.roi, C2.roi, C3.roi). Now, each ROI has a unique density (1 for A, 2 for B, 3 for C, etc). Loading all of these ROIs will ensure that MRIcro shows them in unique colors (shown as AB2C3 in the figure below). Note that if you have ROIs which overlap, you can get ambiguous regions (e.g. areas where A [1 roi] and B [2 rois] overlap will have a density of 1+2=3, and will appear like C [3 rois]. If you want to display multiple ROIs with unique colors and they overlap, each consectuive ROI needs to be copied TWICE as many times as the previous ROI. For example, you would want one copy of A, two copies of B and four copies of C. In this way, each possible combination of ROI overlap will be uniquely represented.
Q: Is there a way that I can show PET/fMRI activation peaks on an image?
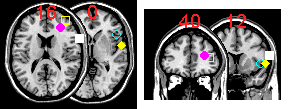
A: Yes, MRIcro can superimpose hotspots onto an MRI scan. To do this, you create a simple text file that describes the coordinates of the hotspots (as described below). Next, open your brain image with MRIcro and right-click on the multislice button. The text below shows a sample text file, and the images on the right shows the corresponding hotspots that are generated. The format of the text file is very simple. First of all, each line of text defines a hotspot, so in our example there are five hotspots. The first three numbers of each line describes the MNI-space coordinates of each hotspot (e.g. the first hotspot is at 67x14x16mm: right, frontal, slightly dorsal of the anterior commissure). The final three numbers describe the shape, radius and color respectively of the hotspot. The shape should be a value 1..8 depending on whether the hotspot should be a square (2), circle (4), diamond (6) or '+' (8) [for filled items, subtract 1 from these values - e.g. value 3 is a filled circle while 4 is an outline of a circle, 7 is a 'X']. The radius is specified in voxels rather than mm. Finally, the colour is a 24 bit value (0..16,777,215). This number is the sum of the red (0..255), green (0..255 * 256), and blue (0..255 * 256 * 256) components of the colour. For example, bright yellow is represented as 65535 (max red = 255, max green = 65280, no blue = 0). It is also important to note that MRIcro places the hotspots on the closest corresponding slice. For example, notice that the second hotspot is at 13mm, however, MRIcro is only displaying slices with a Z of 0 and 16mm in the transverse image. Therefore, the hotspot is drawn on the 16mm slice (the yellow sqaure in the picture). Note that you can also superimpose hotspots on top of lesions. Hotspots can be drawn on transverse [left] or coronal [right] multislice views.
| 67 14 16 1 4 16777215 40 50 13 2 4 65535 30 36 16 3 4 16711935 50 22 0 4 4 16776960 60 0 0 5 4 65535 |
 |
Q: When I overlay a large number of ROIs onto a single image, some of the ROI colors 'bleed' into other tissue. In particular, the brightest voxels (early optic tract, fatty tissue) appear to have the ROI colors. How can I stop this?
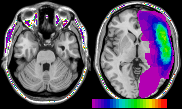
A: The figure above shows this effect - note that the eye sockets appear purple and green when I overlay 25 ROIs on an 8-bit image with bright intensities. This should be an exceptionally rare occurence - this occurs when you overlay a very large number of images onto an 8-bit image. MRIcro is designed to be quick and to conserve memory. With 8-bit images, MRIcro can assign a ROI color to bright image intensities. The generic template images (e.g. the 1mm and 2mm MNI images) do not use the bright values, so MRIcro can utilise these colors. Only in rare cases will individuals overlay large numbers of ROIs, and in rarer still cases will users overlay large numbers of ROIs on an image other than these templates. Note that this is only a visual defect - when measuring ROI volume and intensity, MRIcro does not count these aberrant voxels. In addition, note that this effect only influences 8-bit images. Therefore, the solution to this rare problem is to convert your 8-bit template to a 16-bit image. This is very easy:
Q: What is the format of MRIcro's filename.ROI files? How can I read these files with Matlab or other software?
A: MRIcro's ROI files are stored in a custom designed format that allows the files to be read and saved very quickly while having excellent compression. However, it is a unique and fairly unusual format. Therefore, I think it is much easier to use MRIcro's 'Export ROI as Analyze image' command ('ROI' menu) to convert the compressed ROI images to the uncompressed and simple Analyze format.
Q: Is there a version of MRIcro that runs on a Macintosh?
A: There are native versions of MRIcro for Windows and Linux. However, the compiler I use does not support the Macintosh operating system. Fortunately, there are many ways of running MRIcro on a Macintosh:
Q: Are there any undocumented features in MRIcro?
A: Not anymore. Here are a few features that were added for special projects or development. These features are not as intuitive or as generally useful as the features described in the manual, but others may find them useful.
 |